Korva is a scroll of the internet’s best ideas.
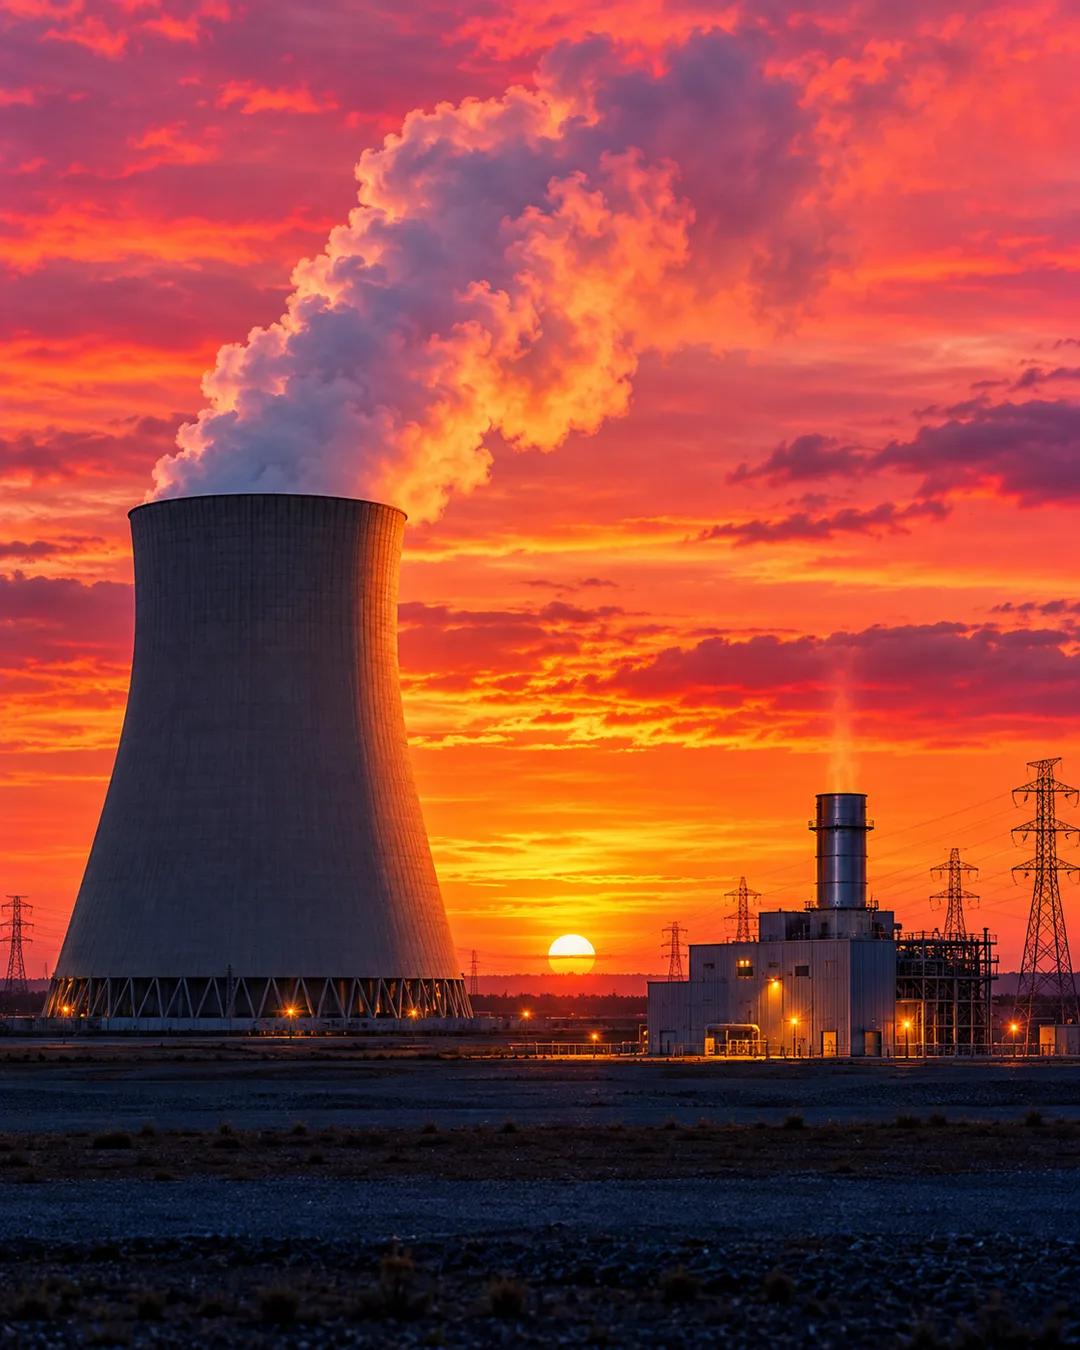
The cheapest power runs first
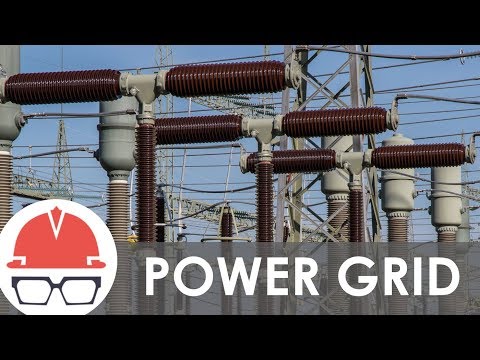
Base load and peaking
Electrical demand follows a fairly consistent pattern. The steady portion, called the base load, goes to the cheapest sources. Peaking, when demand exceeds the base, goes to the higher-cost ones. Operators dispatch this generation capacity in real time, and extreme weather can make demand hard to forecast.
Slow-starting plants
Dispatching is not as simple as flipping on a switch. Large power plants can take hours, days, or even weeks to start up and shut down. Equipment has to come out of service for maintenance, and fuel costs fluctuate.
Wind and solar swings
Wind and solar bring massive and unpredictable variations in capacity, sending irregular sloshes of power into the grid. Balancing supply and demand means weighing all of these considerations at once, and some of them can be predicted while others can't.
Why can't big plants start up quickly?
Coal and nuclear plants make steam to spin a turbine, and the boilers, pipes, and turbine casings are thick metal. Heating or cooling that metal too fast creates thermal stress that can crack it, so these plants warm up and cool down gradually. Nuclear reactors also change their output in carefully controlled steps. Simple-cycle gas turbines, by contrast, can reach full output in roughly ten minutes.
Why are peaking plants so expensive to run?
A peaking plant runs only when demand is at its highest, so the cost of building it is spread over very few hours of output. Many peakers are simple-cycle gas turbines, which burn more fuel per unit of electricity than combined-cycle plants that capture their exhaust heat. Operators accept that cost because these plants can start fast when the base is not enough. Many run only a small fraction of the hours in a year.
How does solar change the daily demand curve?
Solar panels produce most of their power around midday, which pulls down the demand that conventional plants must meet at that hour. As the sun sets, solar output falls just as people return home and use more electricity, so the other plants must ramp up steeply. The California Independent System Operator illustrated this shape in a chart it published in 2013, which became known as the duck curve.