An engineer trapped infinity inside a small circle
By plotting the echo of a radio signal instead of the impedance itself, Philip Smith fit every circuit from short to open on one page.
 Veritasium · The Scariest Chart In Electrical Engineering
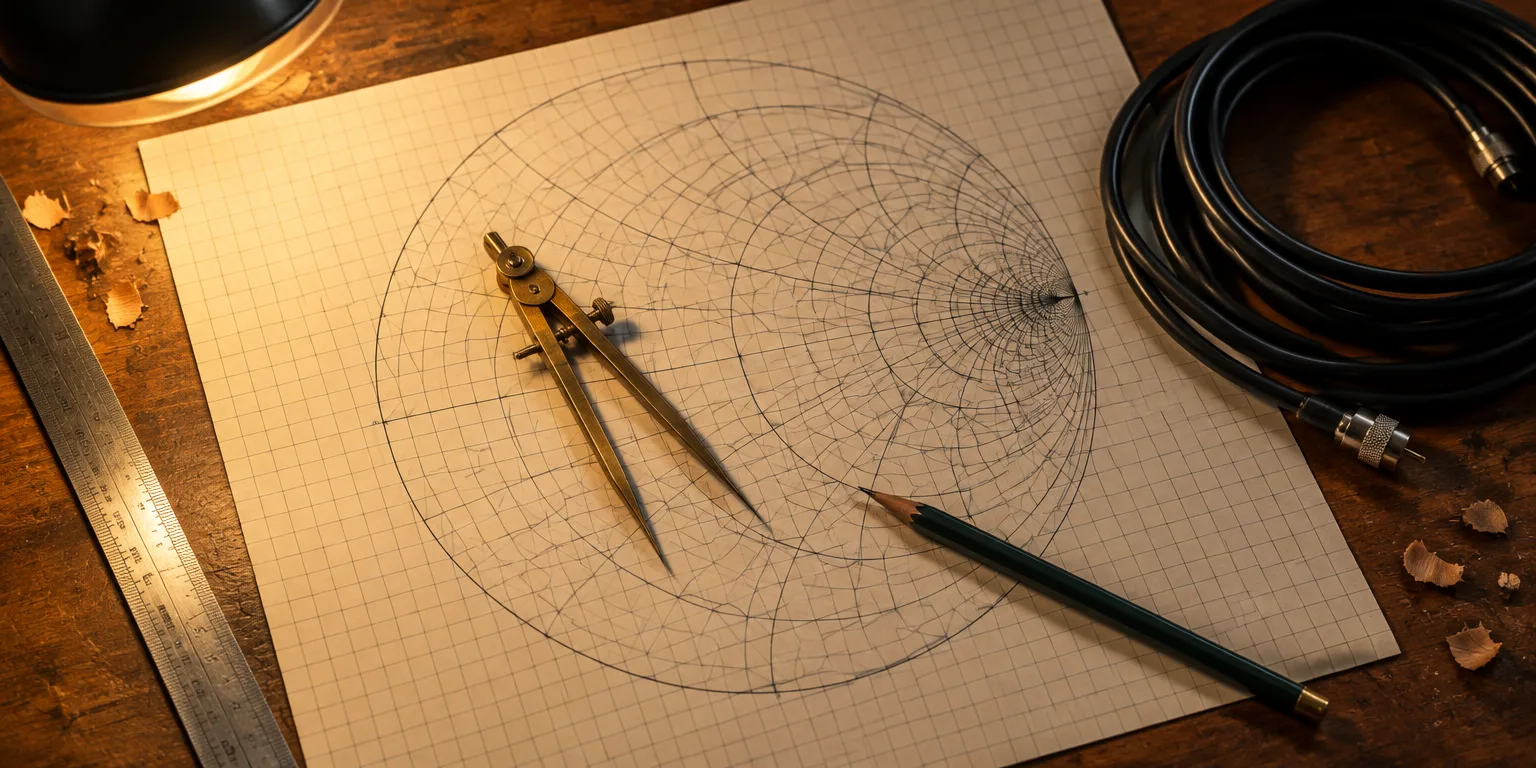
The most feared diagram in electrical engineering looks like a wormhole, a dense nest of circles that turns out to hold infinity inside a small ring. The trick was invented by Philip Smith, an engineer at Bell Labs working on long distance radio links, who needed a practical way to handle signals bouncing around on long wires.
Smith started with a simple problem of scale. Every radio line has a characteristic impedance, often 50 ohms, which is its natural opposition to an alternating current. That opposition, called impedance, combines ordinary resistance with reactance. Reactance is the extra opposition from capacitors, which store charge, and inductors, which are coiled wires, and it shifts the timing between voltage and current. Smith divided every measurement by the line's own characteristic impedance, so one always meant a perfect match, no matter what line you used.
But one chart still had to show everything from zero to infinity. At one extreme is a short, with current rushing through but almost no voltage, for an impedance of zero. An open circuit, where there is voltage but no current, has an infinite impedance. A flat chart of impedance would have to be infinitely large.
Smith, with mathematics colleagues Ferrell and McRae, solved it by warping the math. Multiplying by complex numbers scales and rotates, and a function like one divided by z bends the whole plane of numbers while small shapes keep their right angles. That angle preserving warp is called a conformal map, and it can pull values that stretched to infinity into a finite patch in the middle.
Smith then applied the right warp to a different quantity, the reflection coefficient, which compares the outgoing wave to the wave reflected back. The forward wave keeps its size along a line with no loss, and the reflected wave can be no bigger, so the ratio never exceeds one, and infinity drops out of the picture.
Under that transformation, straight lines of constant resistance become circles. The zero resistance circle is the largest, running from negative one to one. As resistance grows, the circles shrink and crowd toward the point one, zero, which is infinity. Lines of constant reactance become circles arched above the axis for inductance and below it for capacitance.
Every point on the chart can now be read two ways at once. Where the two families of circles cross gives the impedance, and distance from the center gives the size of the reflection. As the reflection coefficient's angle rotates around the center, a point moves along the wire through each impedance a meter would read. The whole infinite range, from short to open, fits inside one finite circle.
Questions people ask
What exactly is impedance?
Impedance is the total opposition to alternating current. It includes resistance, which turns electrical energy into heat, plus reactance from capacitors and inductors, which temporarily store energy and shift the timing between voltage and current.
Why can the reflection coefficient never be larger than one?
On an ordinary passive line, the reflected wave is made from the outgoing wave, so it cannot carry more energy than was sent. Equal size means a magnitude of one, for a total reflection from a short or open, and smaller reflections give smaller numbers. Active devices with amplifiers can produce larger effective reflections, but not a simple wire or antenna.
Are conformal maps used anywhere else?
Yes, they are common in physics and cartography. The Mercator projection of the Earth is a conformal map that preserves local angles at the cost of stretching polar regions. Engineers and physicists also use them to model fluid flow, heat, and electrostatic fields around complicated shapes.