Korva is a scroll of the internet’s best ideas.
Zero schools answered at first
What the survey asked
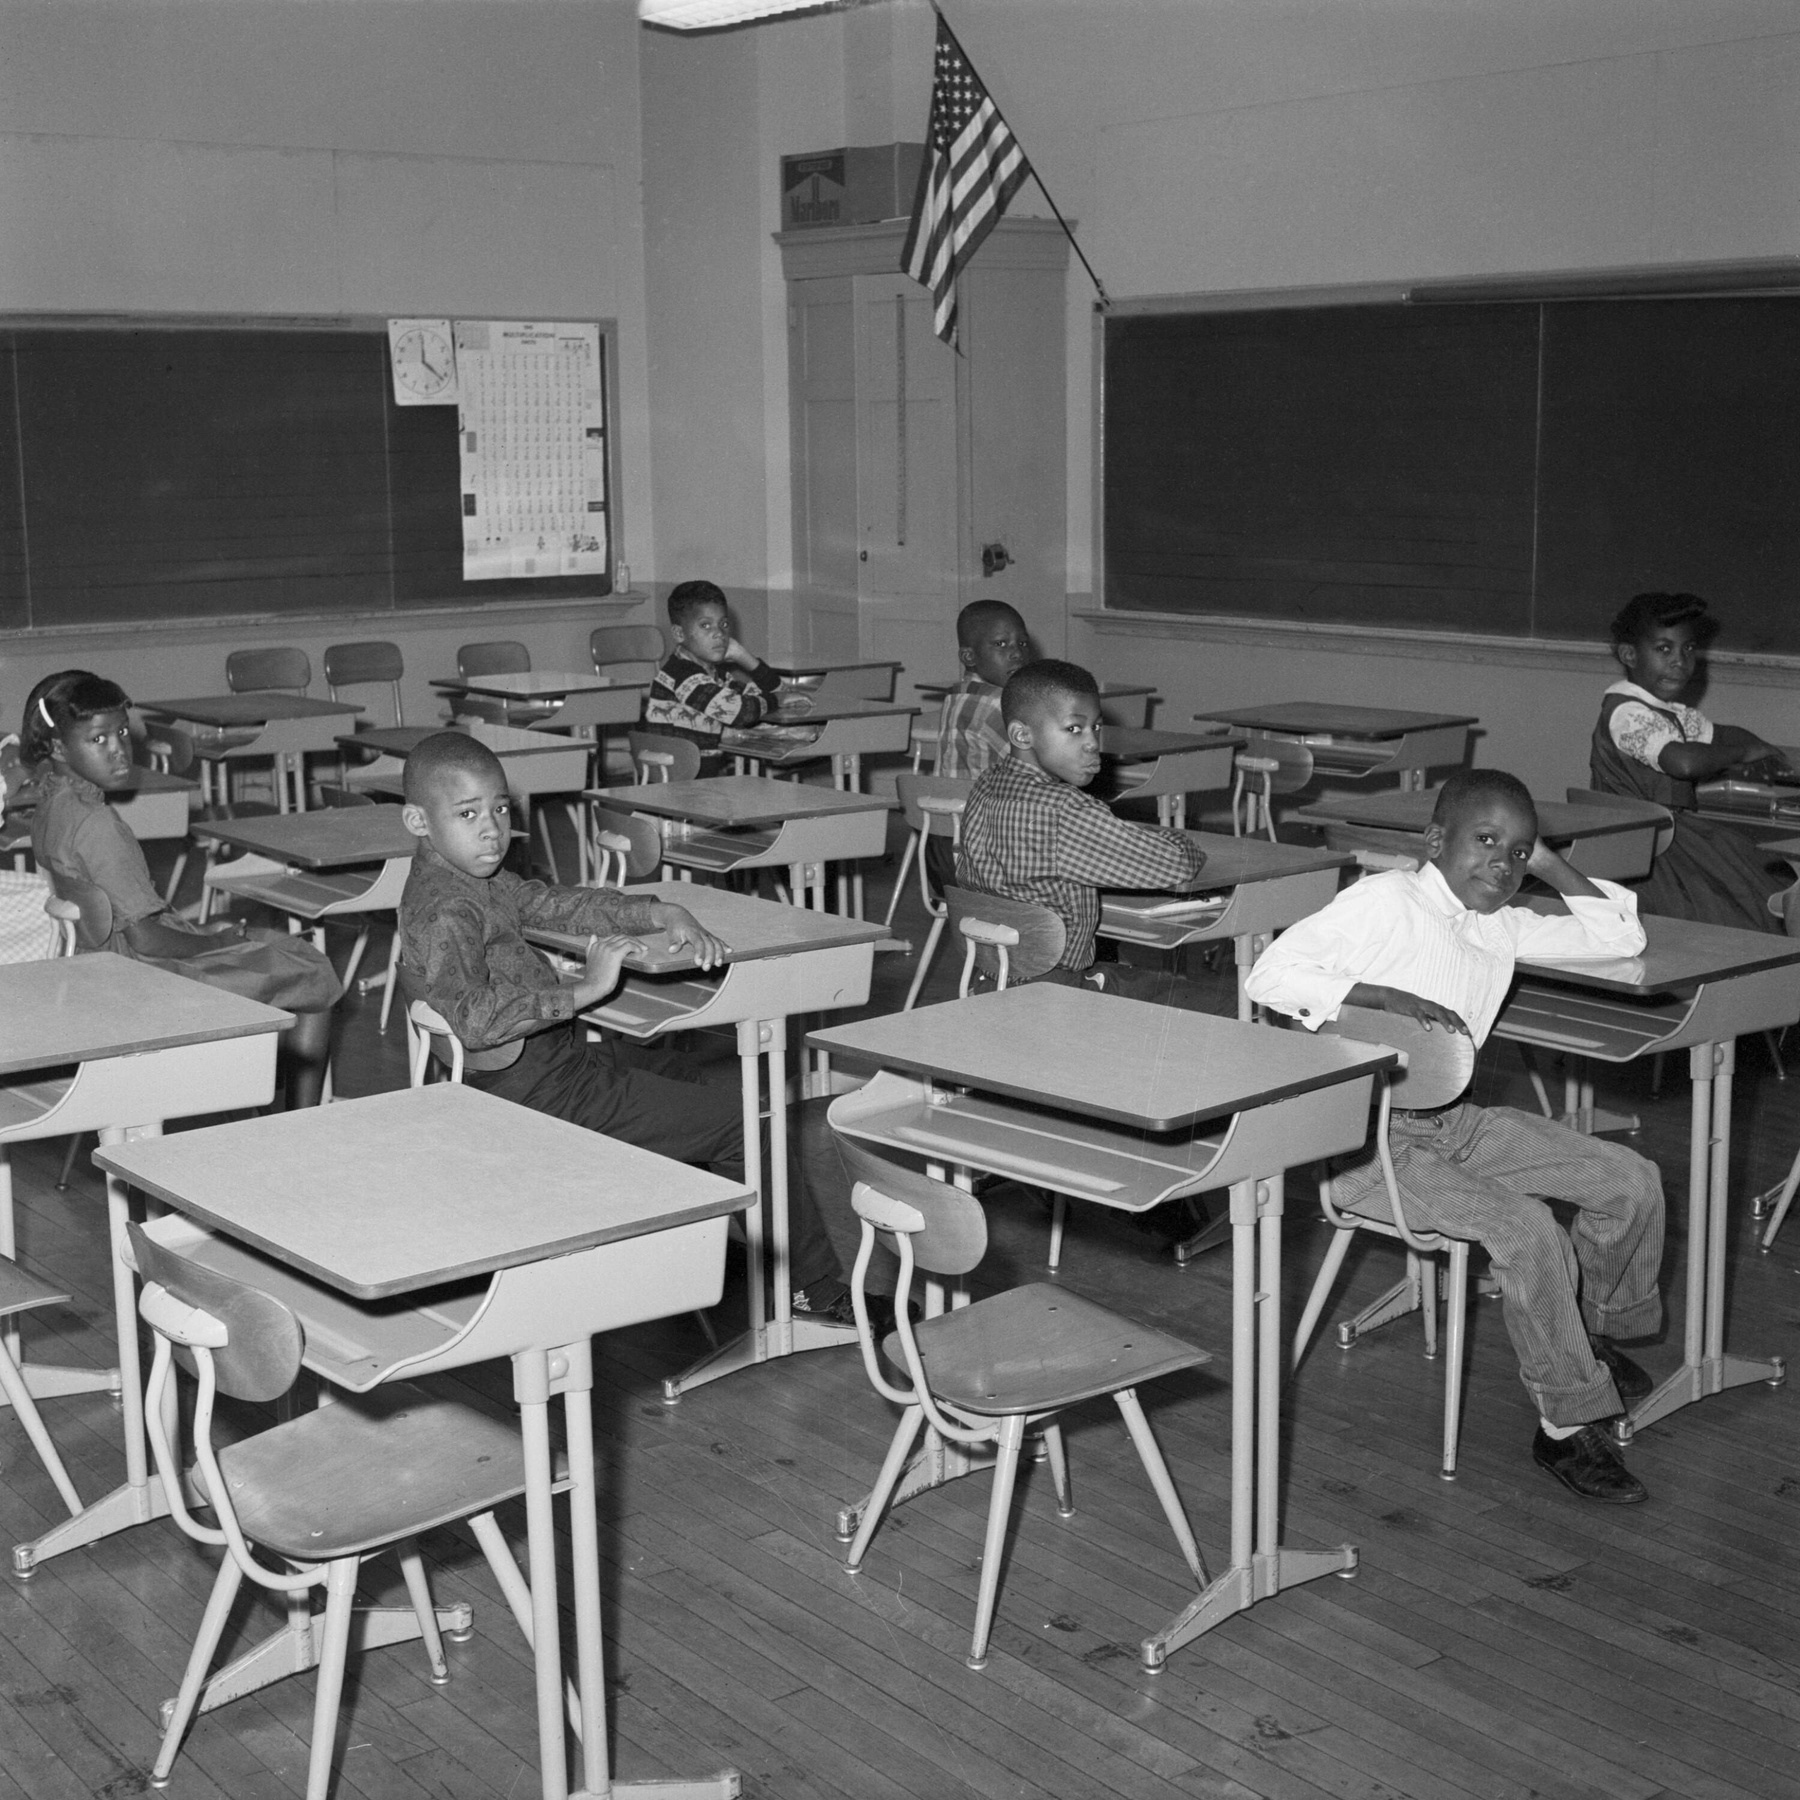
Coleman went past what the law required. His questions counted inputs: how many movie projectors with sound equipment a school owned, how many cataloged volumes sat in its library, and whether it had a science lab. They also reached into students' lives: how many people were in the family, how far the parents went in school, where the grocery money came from, and whether anyone read to them before they started school. Teachers got a 30-item fill-in-the-blank test of their verbal skills.
Collecting the data
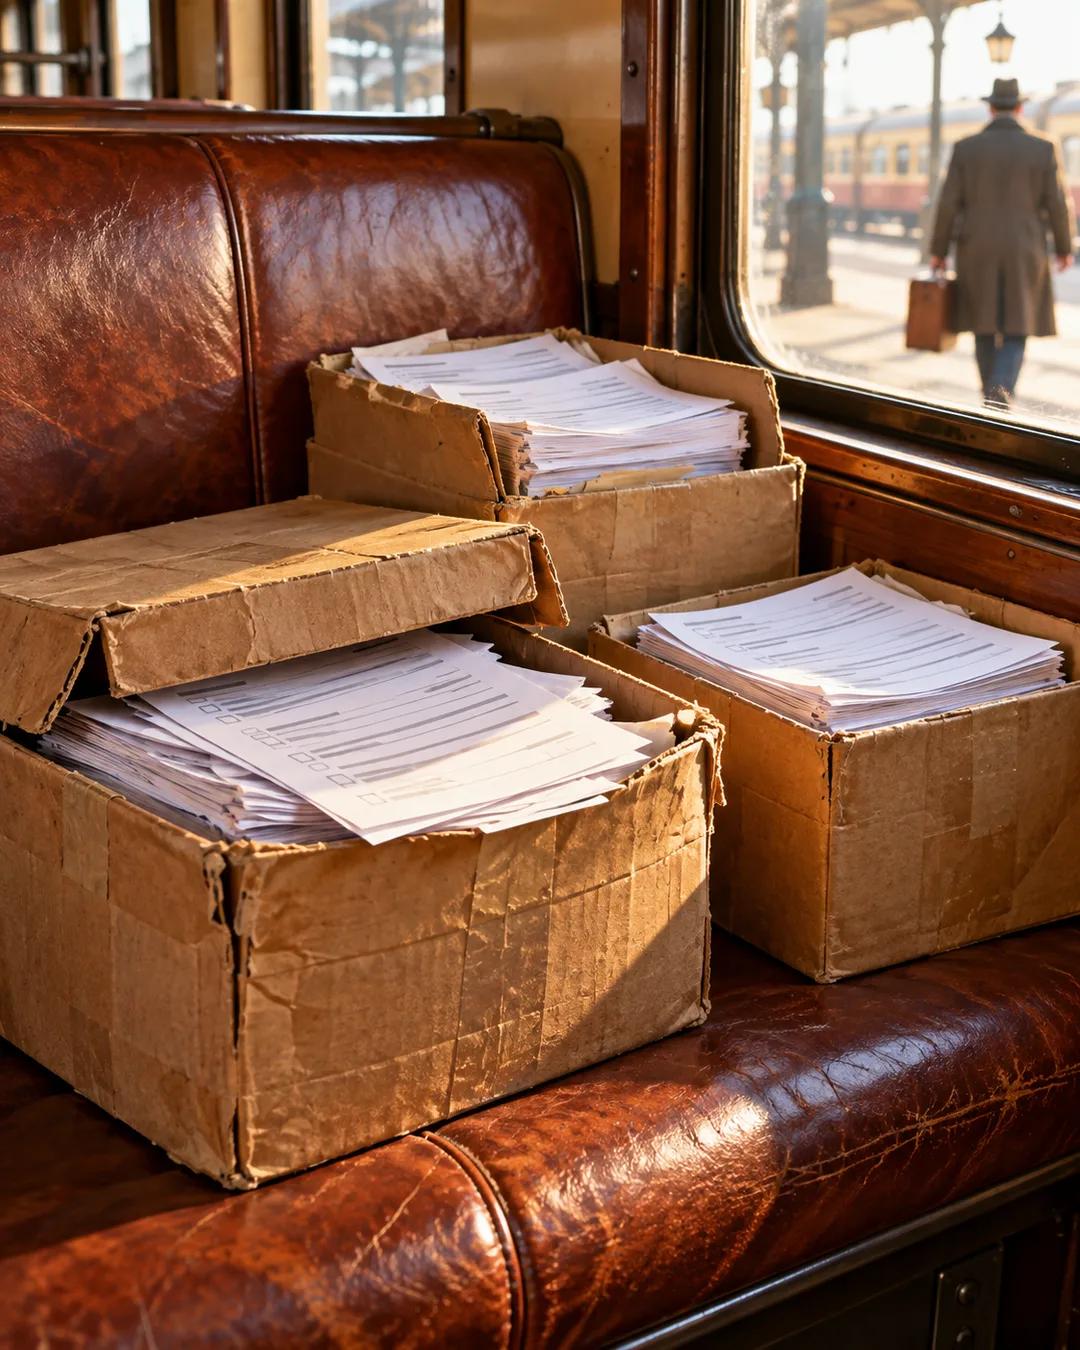
Responses eventually came from roughly 600,000 students in the 1st, 3rd, 6th, 9th, and 12th grades, 60,000 teachers, and about 4,000 schools. Many schools in the South refused to take part, afraid of being seen as deeply segregated, and Chicago and Los Angeles withheld data too. When a post-doctoral researcher hauled boxes of questionnaires onto a train and left them on a seat, the boxes went one direction and Coleman went the other. He had to scramble to get them back.
Crunching the numbers
The numbers went through primitive mainframes in Princeton, New Jersey, tied to the Educational Testing Service. A modern iPhone probably has more computing power than those machines. Coleman locked himself away surrounded by boxes, with bottles of bourbon to take the edge off at night, and his team worked around the clock. In 1966, two years after the Civil Rights Act, the report was done.
Why count projectors and library books?
Before the survey, school quality was judged mostly by inputs such as spending, buildings, and library holdings, on the assumption that more of them meant more learning. Items like the number of volumes in a library or the presence of a science lab were the sort of thing school standards of the era counted. Coleman paired those counts with test results from the same schools, so the assumption could be checked against what students actually knew.
Why would Southern schools avoid the survey?
Ten years after Brown v. Board of Education in 1954, most Southern districts had barely desegregated. The Southern Education Reporting Service counted only about 1 percent of Black students in the South attending school with white students in the 1963 to 1964 school year. A survey that recorded each school's racial makeup would put those numbers on paper for the federal government.
How were 1960s survey results tallied by machine?
Mainframes of the period read data from punched cards, and each card held at most 80 characters. Answers from questionnaires had to be keypunched onto cards before the machine could process them in batches. The IBM 7090, a leading scientific mainframe of the early 1960s, had 32,768 words of core memory.
More from Throughline