A Rejected Diagram Became the Tool That Fixed Radar Hunting U-Boats
After two years of rejections, engineers at wartime MIT used a strange circle diagram to tune radar fast enough to spot submarines at night.
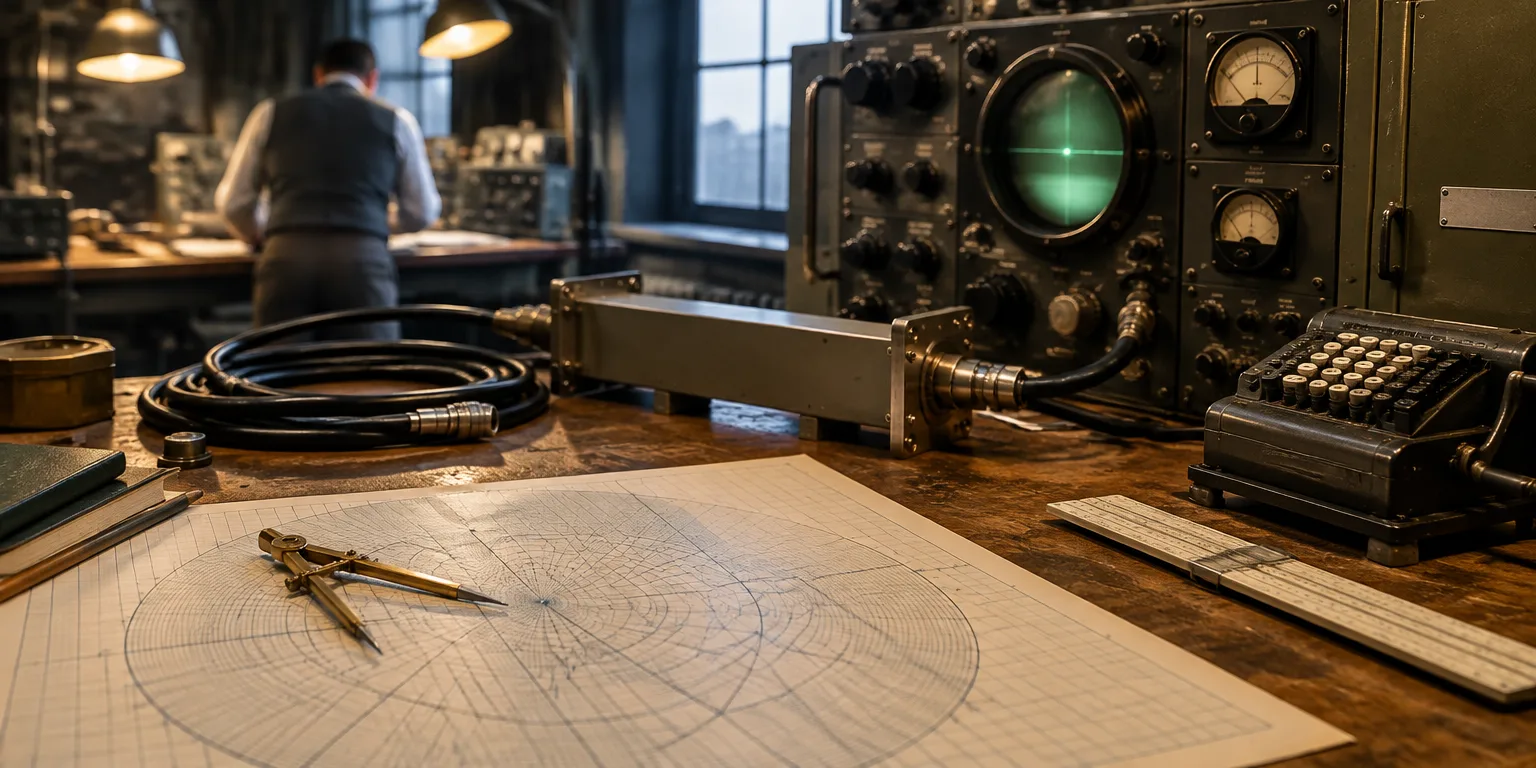
 Veritasium · The Scariest Chart In Electrical Engineering
At the MIT Radiation Laboratory during World War II, engineers needed to get new radar sets working quickly. With combat underway, there was no room for repeated guesswork.
The gear was short-wave radar meant to help protect Atlantic convoys. German submarines were destroying Allied freighters more quickly than shipyards could replace them, and after dark or in rough seas the hunters were nearly invisible.
The new equipment could pick out a submarine riding on the water even on a pitch-black night. That capability only helped if crews could keep the sets properly tuned, and for that they turned to an odd-looking round diagram.
The diagram had been made in 1937, before the war, by Philip Smith, who had joined Bell Labs in 1928. He had been assigned to beam wireless messages from New Jersey toward receiving stations far away in England and Argentina. To sharpen the beam, his group tied together more than 20 antennas with cables stretching well past 2,000 meters.
Some of his energy never arrived. It echoed back along the cable and clashed with the outward flow. Decades before, Oliver Heaviside had worked out the mathematics for electrical waves moving along wires, but applying that math to stop echoes demanded grinding through lengthy formulas with only the hand-powered calculating tools of the time.
In the 1930s that puzzle gained military weight. Getting clean messages across oceans offered a way to direct vessels, planes, and supply chains, tasks central to fighting a war. So researchers in other major powers took up the same challenge Smith faced. Amiel Volpert, an engineer in the Soviet Union, started on it. Tosaku Mizuhashi, an engineer in Japan, did too. Each side sought an easy picture-based aid that would show how to match the cable to the equipment at its end so the power goes out instead of bouncing back.
Smith drew such an aid, a circle chart that shows how to match a line to its load, the equipment at its end. For about two years, technical journals answered slowly or said no, until the trade magazine Electronics agreed to print it. Practicing engineers trusted familiar calculation routines, and his approach asked them to learn an unfamiliar visual way of working.
Combat transformed its fate. His diagram became a daily fixture in the Radiation Laboratory for adjusting radar. Once fighting stopped, those same engineers carried it to private business, to university posts, and to the textbooks they wrote.
Questions people ask
What exactly does the chart help engineers fix?
It helps engineers match the cable and the load so power leaves instead of bouncing back. Impedance is the opposition a circuit offers to alternating current. When the two sides differ, part of the signal reflects and is lost. The chart shows what to add so nearly all the power goes out.
Why was radar so important in the battle of the Atlantic?
Surfaced U-boats at night were hard to spot by sight. Microwave radar could pick out a submarine on the surface even in complete darkness. That let Allied forces find boats that could otherwise hide in the night.
Why would a useful invention be rejected for two years?
Working engineers already had their own calculation methods, and Smith's circular diagram required a completely different way of thinking. Adoption was slow at first, but World War II changed everything, because engineers needed a fast and reliable way to fix radar systems.